Visualizing Crowds

An interactive visualization that makes crowd sizes tangible by placing people in recognizable spaces.

3D
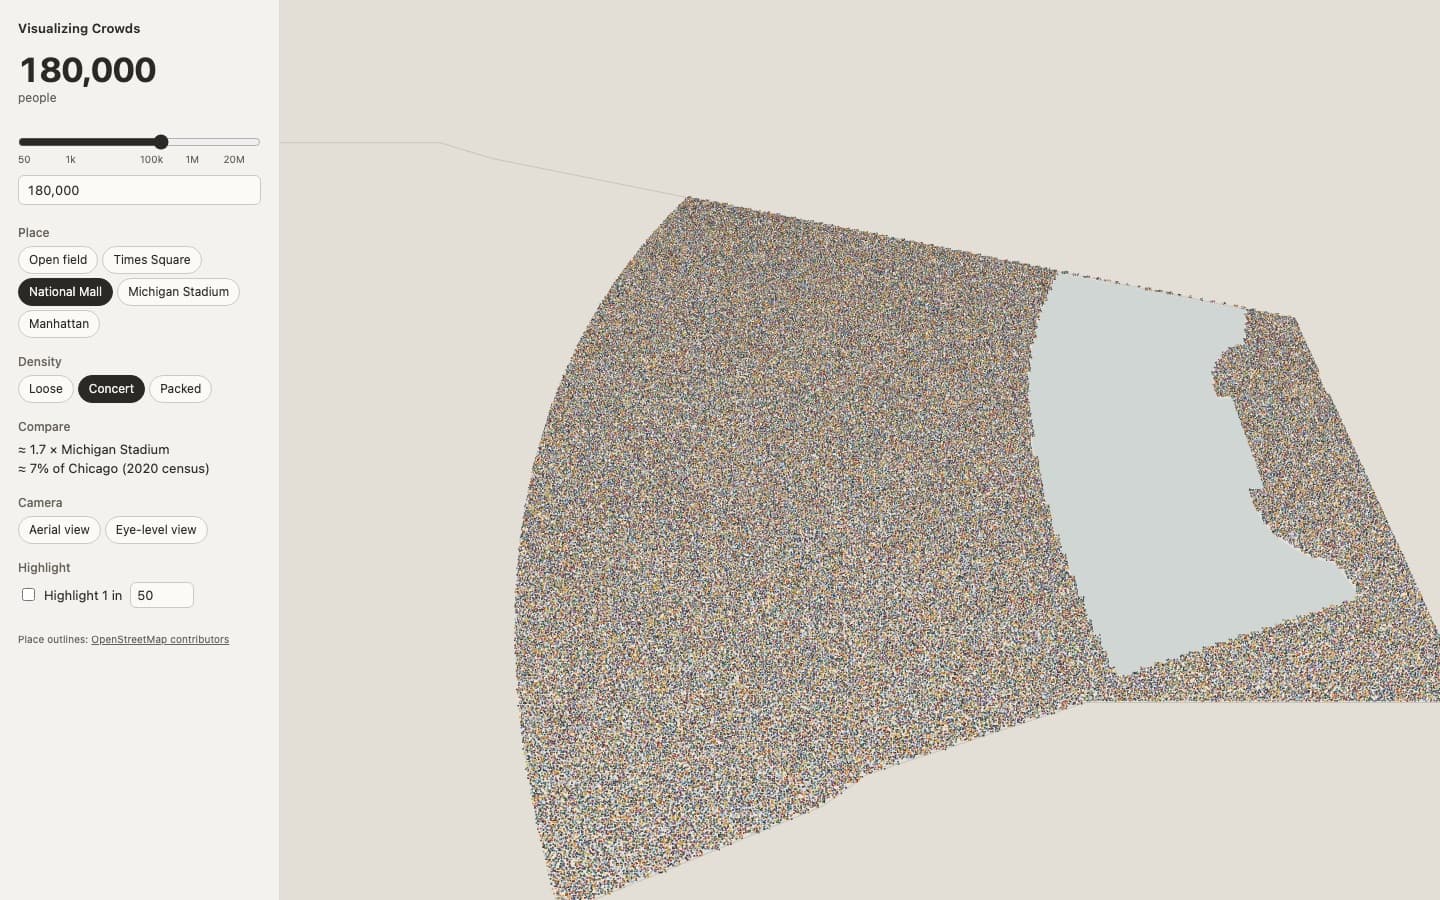
Visualizing Crowds aerial view: 180,000 people at concert density filling the National Mall outline, with the place, density and camera controls on the left
180,000 people at concert density on the National Mall, from above. Captured from the live app; place outlines from OpenStreetMap.
Status
Working prototype, live
Tools
TypeScript, React, Three.js, Vite
Links
Open the appSource

Type a number of people and see them placed in a place you know, such as Times Square, the National Mall, Michigan Stadium or Manhattan. Density and camera change, and the count is compared with familiar references.

The live app: 180,000 people moved between places and densities, then seen from eye level and from above.

Decisions

Draw detail only where it can be seen

Near people are sprites, the middle distance is dots, and the far field is a ground shader, with a shared dissolve between tiers so a count in the millions still renders.
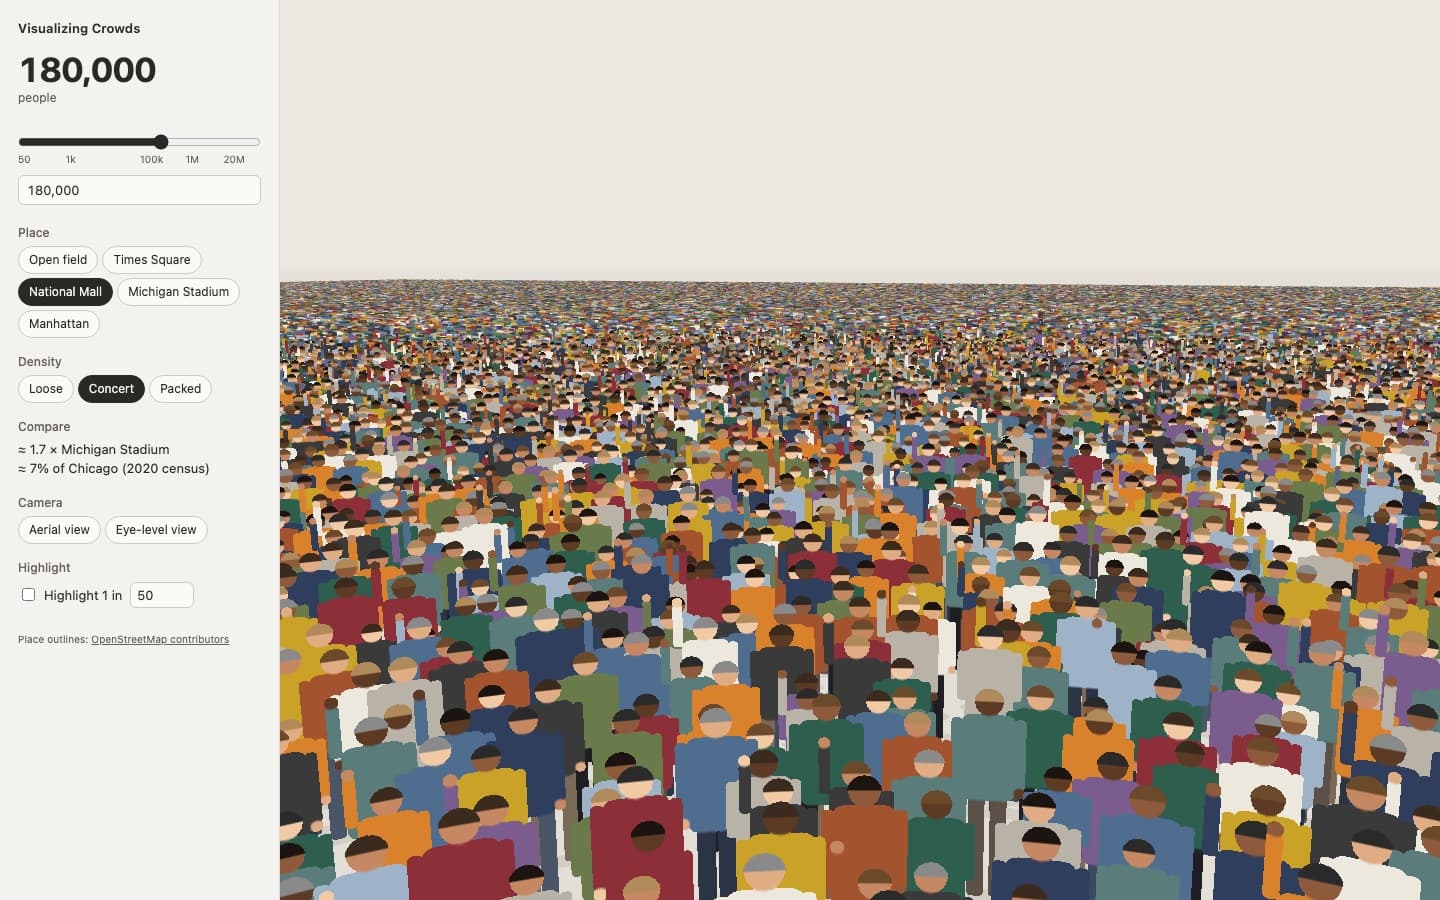
Visualizing Crowds eye-level view: the same 180,000 people as a wall of individual figures stretching to the horizon
The same crowd from eye level, where the near figures are sprites. Captured from the live app.

Say when the place is full

When a count does not fit the chosen place at that density, the app reports the overflow straight away instead of silently piling people up.
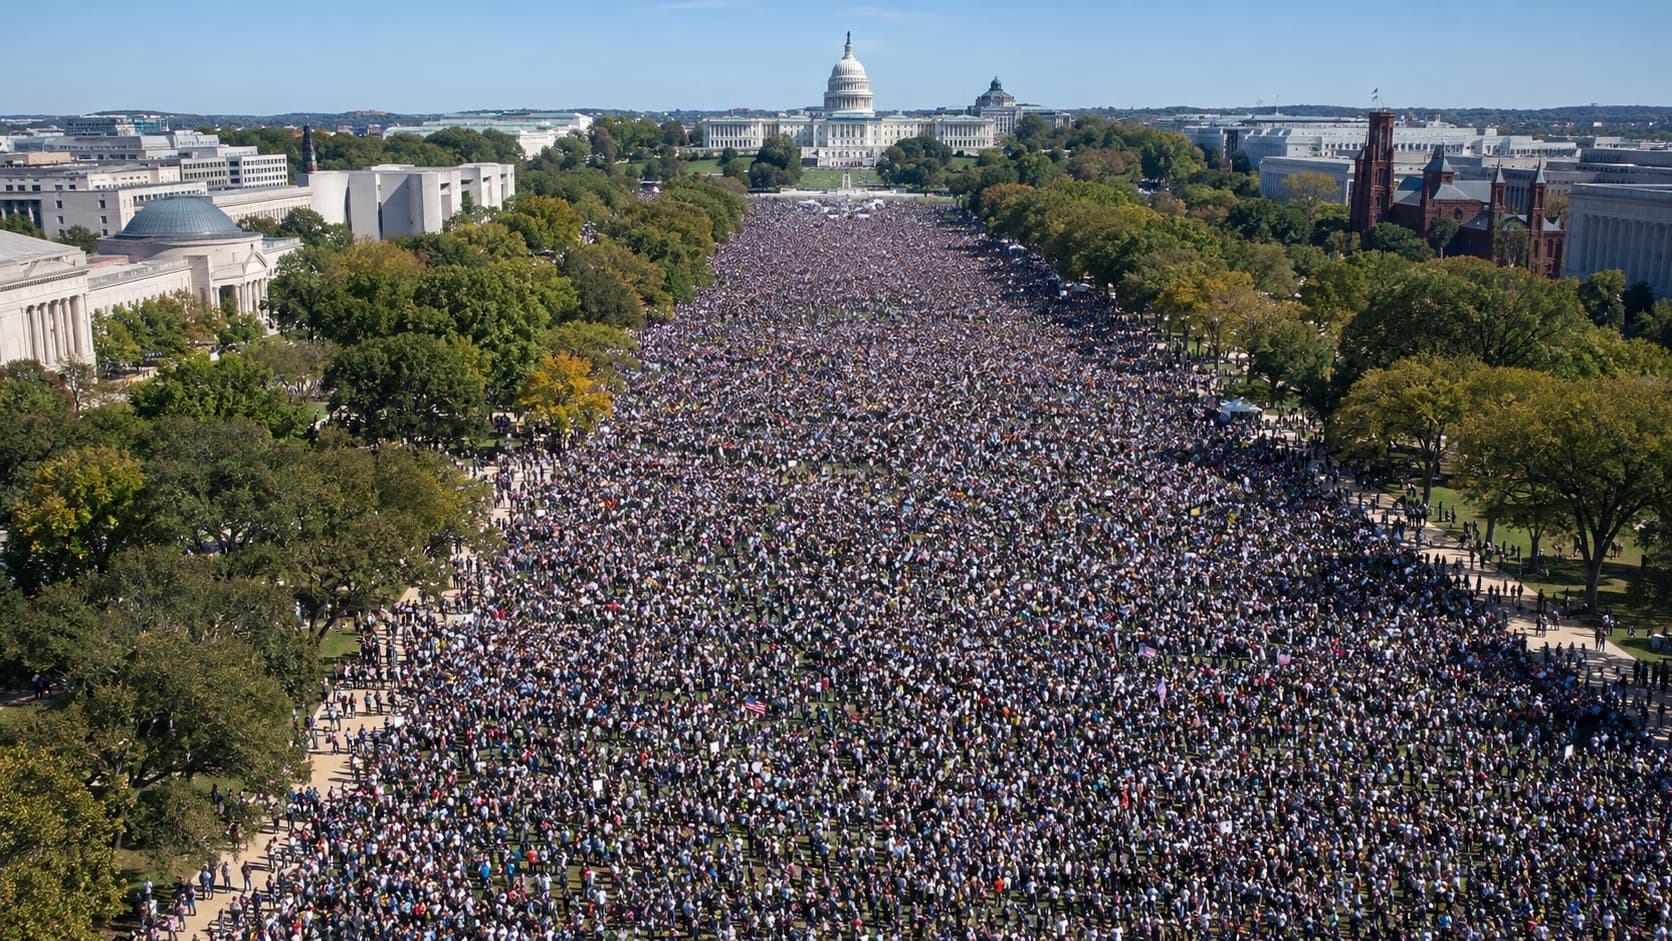
AI-generated illustration of a dense crowd filling the National Mall from the air, with the Capitol in the distance
For comparison: an AI-generated illustration of a crowd on the National Mall, as a drone might see it. Not a photograph of a real event, and not from the app.